Opinion:Having complex economy, Belarus can survive high inflation and external macroeconomic shocks

This brief uses Economic Complexity Index (ECI) to discuss economic diversity of transition economies in post-Soviet decades, and the relations between economic diversification and per capita income.
The search for and construction of appropriate predictors of economic development are among the main goals of economists and policy-makers. Education, infrastructure, rule of law, and quality of governance are all among the commonly used indicators based on inputs. The recently formulated Economic Complexity Index (Hidalgo and Hausmann, 2009) is a new promising predictor of economic development characterizing the overall complexity and diversity of the economy as a system.
Indeed, the importance of production and trade diversification for economic development has been highlighted by the economic literature. Numerous studies have found a positive relationship between diversified and complex export structure, income per capita and growth (Cadot et al., 2011; Hesse, 2006; Hausmann et al., 2007). In line with this, Hausmann et al. (2014) demonstrate the predictive properties of the ECI for economic development and GDP per capita, which implies that the ECI can serve as a useful complement to the input-based measures for policy analysis by reasoning from current outputs to future outputs.
This brief uses the ECI to discuss the evolution of economic diversification, its relationship to per capita income in transition economies in the post-Soviet decades, and its policy implications.
How is economic complexity measured?
The economic complexity index (ECI) is a novel measure that reflects the diversity and ubiquity of a country’s exports. The index considers the number of products a country exports with revealed comparative advantage and how many other countries in the world export such goods. If a country exports a high number of goods and few other countries export these products, then its economy is diversified (a wide range of exports products) and sophisticated (only a few other countries are able to export these goods). Thus, the measure tries to capture not a specific aspect of the economy, but rather its overall sophistication.
For example, Japan, Switzerland, Germany and Sweden have been in a varying order at the top of the ranking of the Economic Complexity Index from 2008 until 2013. This means that these countries export a large number of highly sophisticated products.
In contrast, Tajikistan is among the countries at the bottom of the world ranking by the ECI with raw aluminum, raw cotton and ores making up 85% of all Tajikistan’s exports in 2013. However, not only are Tajikistan’s exports concentrated among very few narrow products, these products are also ubiquitous and the ability to export them does not require knowledge and skills that can be used in the production and exports of many other products.
As the index for each country is constructed relative to other countries’ exports, it is comparable over time.
What can we learn from the economic complexity of transition economies?
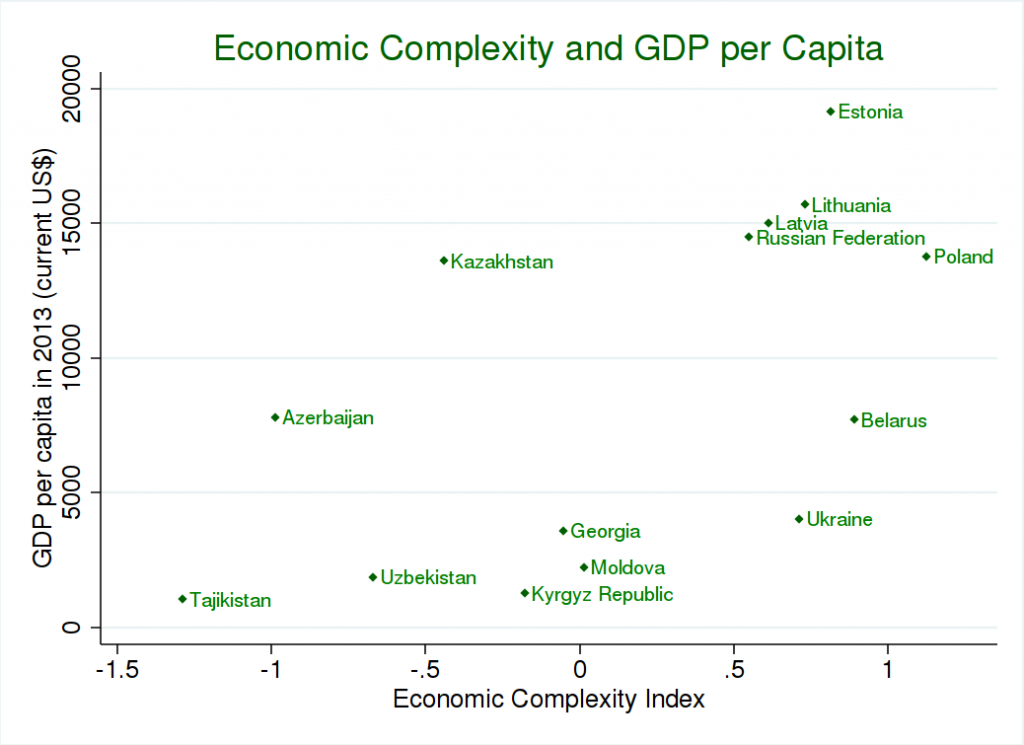
The economic complexity index can serve as a useful indicator for understanding transition economies in the post-Soviet period. A strong relationship between GDP per capita and economic complexity is found in the sample of transition economies in Figure 1. This figure presents the relationship for the last year for which data is available for the sample of 13 post-Soviet states and Poland. As can be seen in Figure 1, the economic complexity is positively related to income per capita. This is especially true for Poland, Estonia, Lithuania, Latvia and Russia, who all have higher than average economic complexity and high levels of per capita income. While Belarus and Ukraine also have diverse and complex economies, they have somewhat lower income per capita than the first group.
Figure 1. Economic Complexity and GDP per capita

Source: Data on GDP per capita is from the World Bank, and the data on the Economic Complexity Index is from the Observatory of Economic Complexity.
Natural resource-rich, or rather, oil-rich countries are the exception from the abovementioned correlation. Most transition countries with below than average economic complexity are characterized by low income per capita levels, except for Kazakhstan and Azerbaijan, which are oil-rich countries. Still, the overall picture is straightforward: countries with a complex export structure have a higher level of income.
One of the advantages of a systemic measure like export complexity is its straightforward policy application. The overall diversity and sophistication of the economy can thus be a complementary measure for the assessment of economic progress and development to GDP and GDP per capita, which are more susceptible to the volatile factors such as commodity prices.
Figure 2 shows the development of economic complexity for 14 post-Soviet countries and Poland between 1994 and 2013 (due to data availability issues, only one year is available for Armenia).
First, we see that the economic complexity has diverged over time, although there is some similarity in the rankings among countries over time. The initial closeness is likely related to the planned nature of the Soviet economy that aimed to distribute production among Soviet Republics. In the post-Soviet context, however, the more complex economies (Estonia, Belarus, Lithuania, Ukraine, Latvia, Russia) kept or increased their sophistication and diversity of exports. Poland is the leading economy in terms of complexity, both in the beginning and towards the end of the sample period. Belarus, the second most complex economy in 2013 and the most complex economy in several years prior, shows an increasing trend in its sophistication of exports. Although its GDP per capita is noticeably lower than what would be expected from such a sophisticated economy, the complex production structure may explain its ability to withstand a permanent high inflation and external macroeconomic shocks. Some others, e.g., Tajikistan and Azerbaijan, saw a decreasing trend in economic complexity; Georgia and Kazakhstan, notably, lost in economic complexity but also in their ranking among their peers.
Figure 2. Economic Complexity of Transition Economies

Source: Data on GDP per capita is from the World Bank, and the data on the Economic Complexity Index is from the Observatory of Economic Complexity.
Conclusion
This brief revisited the economic complexity of transition economies and its evolution since the 1990s. The post-Soviet and other transition countries have had diverging economic development paths: Some have managed to build complex production economies, while others’ comparative advantage remains in raw materials. These differences are also reflected in their income levels.
Across the world, economic diversification is associated with higher per-capita income. As the brief showed, this relationship also holds for the post-Soviet countries; policy-makers should take economic diversification seriously. Increasing economic complexity may well pave the path to higher income levels.
-
03.01
-
07.10
-
22.09
-
17.08
-
12.08
-
30.09


